Desk Utilization Rate: How to Measure Office Occupancy
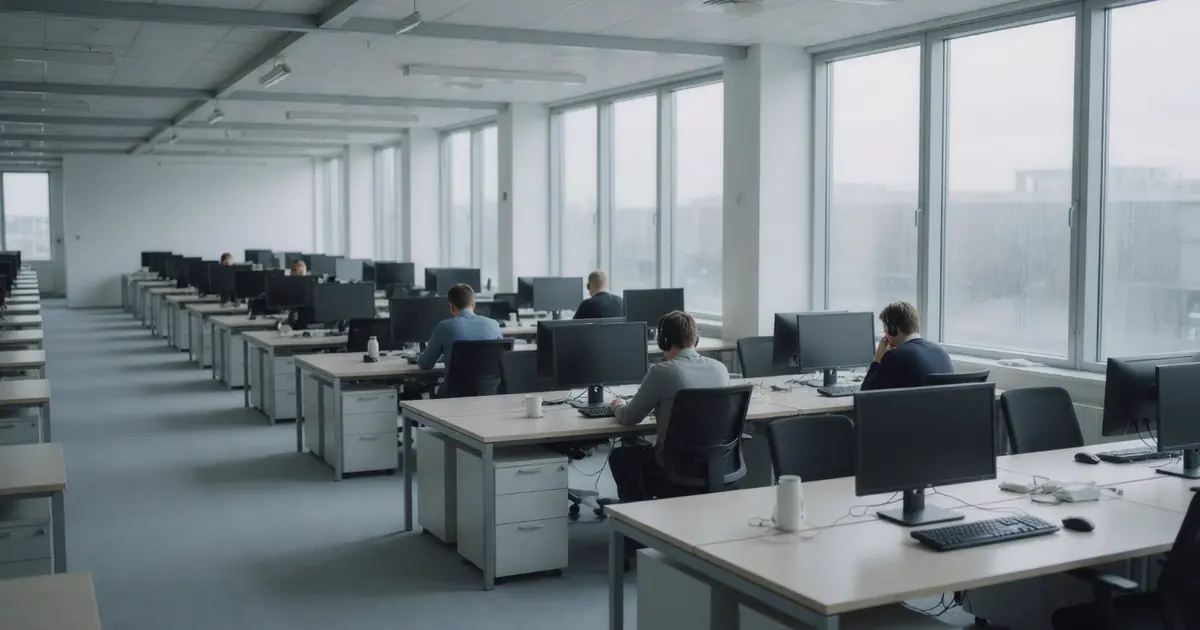
Desk utilization rate is the share of your desks that are actually used in a given period: desks used divided by desks available, times 100. Measure it by day, report the average and the peak separately, and plan space to the peak with a buffer, never to the average. Building entry counts, booking data and occupancy sensors all produce a number, but they measure different things, so pick one method, write down its counting rule and keep it.
The rest of this post gives the formulas, a worked example, and what each data source can and cannot tell you.
Four numbers that get confused
We looked for a formal definition of these terms from RICS, IFMA or ISO and did not find a published set that covers all four, so here are the working definitions we use. What matters is that you write yours down and use them consistently.
| Metric | Formula | What it answers |
|---|---|---|
| Attendance | People who came in ÷ people assigned to the office | How many people show up |
| Desk utilization rate | Desks used ÷ desks available | How much of the desk supply gets used |
| Peak utilization | The highest daily desk utilization in the period | How much space you actually need on the busiest day |
| Desk sharing ratio | People assigned ÷ desks available | How hard you are already sharing |
Attendance and utilization are not the same number. A team of 100 sharing 70 desks can have 60% attendance and 86% desk utilization on the same day.
A worked example
An office has 200 desks and 260 people assigned to it, a sharing ratio of 1.3. Over one week, the number of desks used each day was:
| Day | Desks used | Desk utilization |
|---|---|---|
| Monday | 90 | 45% |
| Tuesday | 140 | 70% |
| Wednesday | 135 | 68% |
| Thursday | 110 | 55% |
| Friday | 45 | 23% |
| Week | Average 104 | Average 52%, peak 70% |
The average says half the floor sits empty. The peak says Tuesday needs 140 desks, and once you allow a buffer for visitors, new hires and a bad Tuesday, you are close to the 200 you have. Cutting space to the average would leave people standing on Tuesdays and Wednesdays.
So report both, by day of week. The decision about how much space to keep lives in the peak. The decision about whether to consolidate days, so the peak flattens, lives in the gap between the peak and the average.
Where the data comes from
Every source gives you a number. Each one measures something slightly different.
| Source | What it measures | Blind spot |
|---|---|---|
| Badge or access control entries | Who entered the building | Says nothing about desks, and usually counts a person once a day |
| Desk booking | Who planned to use which desk | No-shows and walk-ups |
| Occupancy sensors | Whether someone is at a desk, minute by minute | Cost, and the counting rule decides the answer |
| Walk-through counts | Desks in use at the moment of the count | Misses peaks between counts, and takes staff time |
| Seat assignments | Who is assigned where | Assignment is not presence |
The counting rule is the trap with sensors. Does a desk with a laptop and a coat on it count as used while its owner is in a meeting for an hour? Researchers study exactly this. A 2025 study in the Journal of Corporate Real Estate, "Optimizing office space: the role of passive occupancy," drew on 7,522 desk sensors across ten office sites in Finland, Norway and Sweden over six months. Whatever rule you pick for that hour, write it down, because changing it later will move your utilization figure without a single person changing their habits.
What the national numbers measure
Two widely quoted office indexes are useful for context and misleading as a benchmark for desks.
- Kastle Systems' barometer, from an access control company, showed a national average of 56.1% at the end of October 2026. It counts building entries, not desks: "For each person, we count only their first building entry each day," and compares that to a pre-pandemic baseline. See the Kastle barometer.
- Placer.ai's office index, built from mobile location data, found that nationwide office visits rose 4.0% year over year in September 2026, narrowing the gap with September 2019 to 25.5%. See the September 2026 index.
Both are attendance measures against a pre-pandemic baseline. Neither tells you how many of your desks were used. Compare your own building to itself, week over week, and use these only to see which way the market is moving.
Privacy, if you track people rather than desks
Desk data tied to a named employee is personal information. In California, the CCPA's temporary exemption for employee data expired on December 31, 2022, so employee data has been covered since January 1, 2023. The law applies to businesses that meet its thresholds, including gross annual revenue of $26.625 million or more, according to the California Privacy Protection Agency.
The practical answer for most space decisions is to measure desks, not people. Utilization by floor, area and department answers the space question without a record of where any one person sat.
How to measure it in five steps
- Count the desks you actually offer, excluding broken, reserved and storage desks, and keep that number current.
- Pick one source and its counting rule, from the table above. Write down what counts as "used".
- Collect daily, by area. At least four normal weeks, avoiding holidays.
- Report average and peak by day of week, per floor or department.
- Decide from the peak. Then ask whether shifting team days would flatten it before you change the space.
How MAFM handles it
MAFM keeps floor plans with desk-level assignments and reports occupancy by day, department and area, along with cost per seat, so the space question sits next to the lease that pays for it. If a renewal decision is coming, our guide on what to abstract from every lease covers the dates that matter. See the platform overview for how space fits with the other modules.
Frequently asked questions
How do you calculate desk utilization rate?
Divide the number of desks used in a period by the number of desks available, then multiply by 100. Calculate it per day, then report both the average and the peak day, because space has to be planned to the peak.
What is a good desk utilization rate?
There is no published standard. A high average with a peak close to 100% means you are short of desks on busy days. A low average with a low peak means space you are paying for and not using. Judge it against your own peak, not an industry figure.
What is the difference between occupancy and utilization?
Occupancy, or attendance, usually means how many people came into the building. Desk utilization means how many desks were used. A shared desk floor can have modest attendance and high desk utilization at the same time.
Is badge data enough to measure desk utilization?
No. Badge data shows who entered the building, usually counting each person once a day, so it measures attendance. To know how many desks were used, you need bookings, sensors, walk-through counts or desk check-ins.
If your space plan still comes from a spreadsheet of seat assignments, talk to an operator who runs their own floors on MAFM.